On this page
- Micro case study
- Internal tool · desktop web
- Inventory and operations
- Accessibility
Urbanfit Control Panel: one screen for every branch
An internal tool for Urbanfit's supplement business. Admins, warehouses and franchise shops use it to move stock, price products, take orders and see sales, each with only the access their role needs.
Stock in many places, truth in none
Urbanfit sells supplements through warehouses and franchise shops. The Control Panel had to give each of them one shared, correct view of stock, prices and sales.
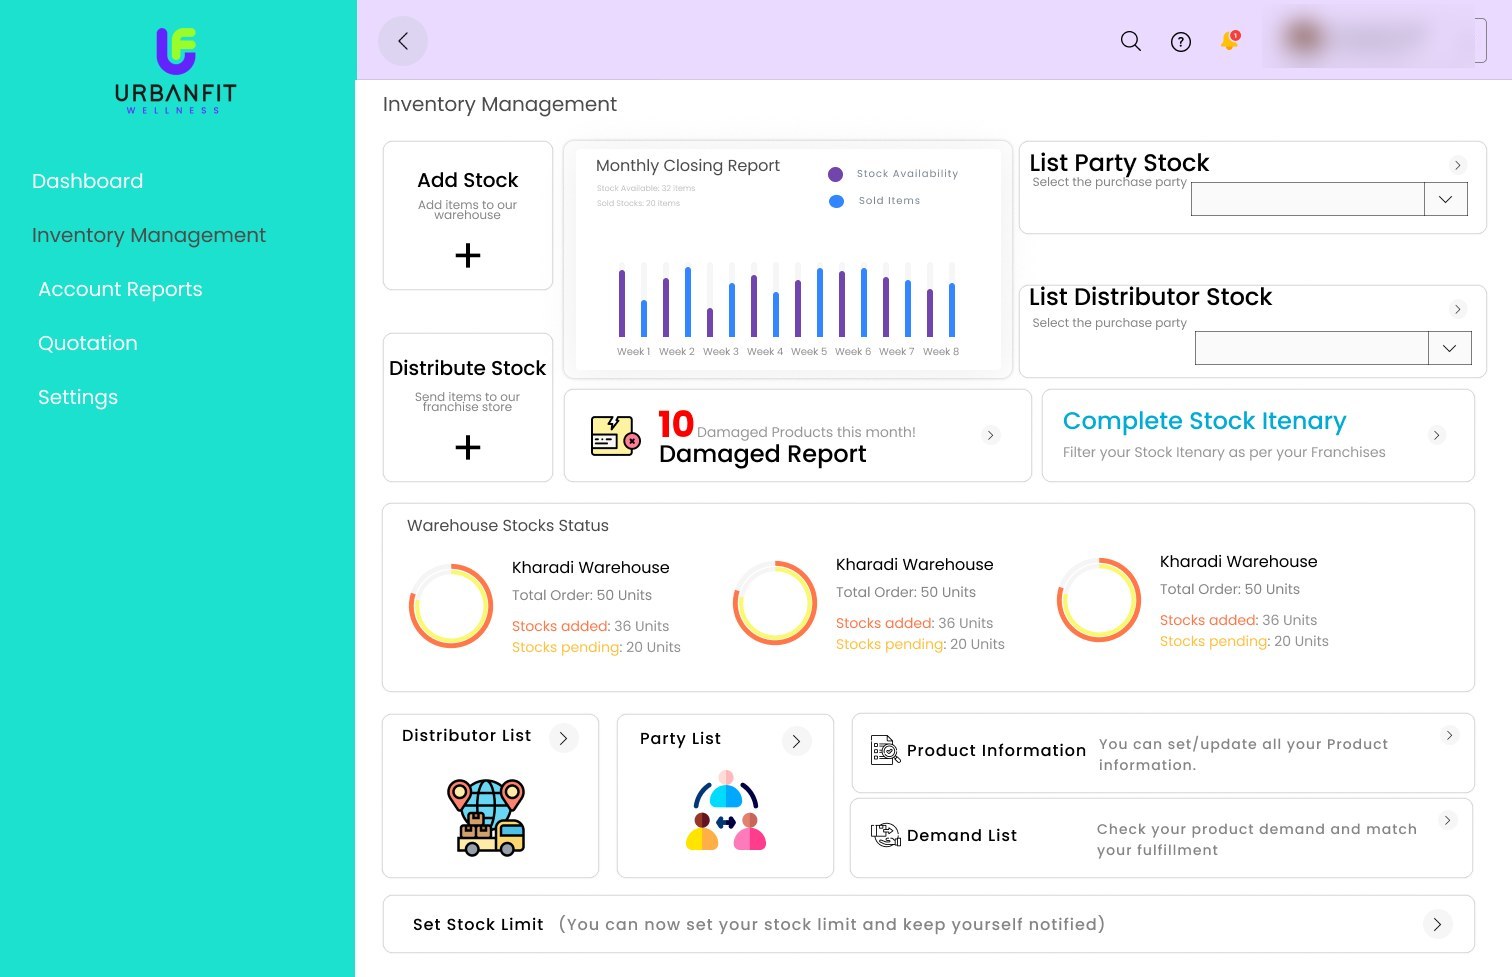
- Stock moves between placesWarehouses add stock from distributors and send it to shops. Each transfer had to be traceable, with pending units visible.
- One product, many pricesThe same tub sells online, in a shop and to gym trainers at different rates, all worked out from one purchase price.
- Three roles, three viewsAn admin sees every branch; a franchise owner sees only their own shop. Permissions decide who can add stock or users.
Five sections, three dashboards
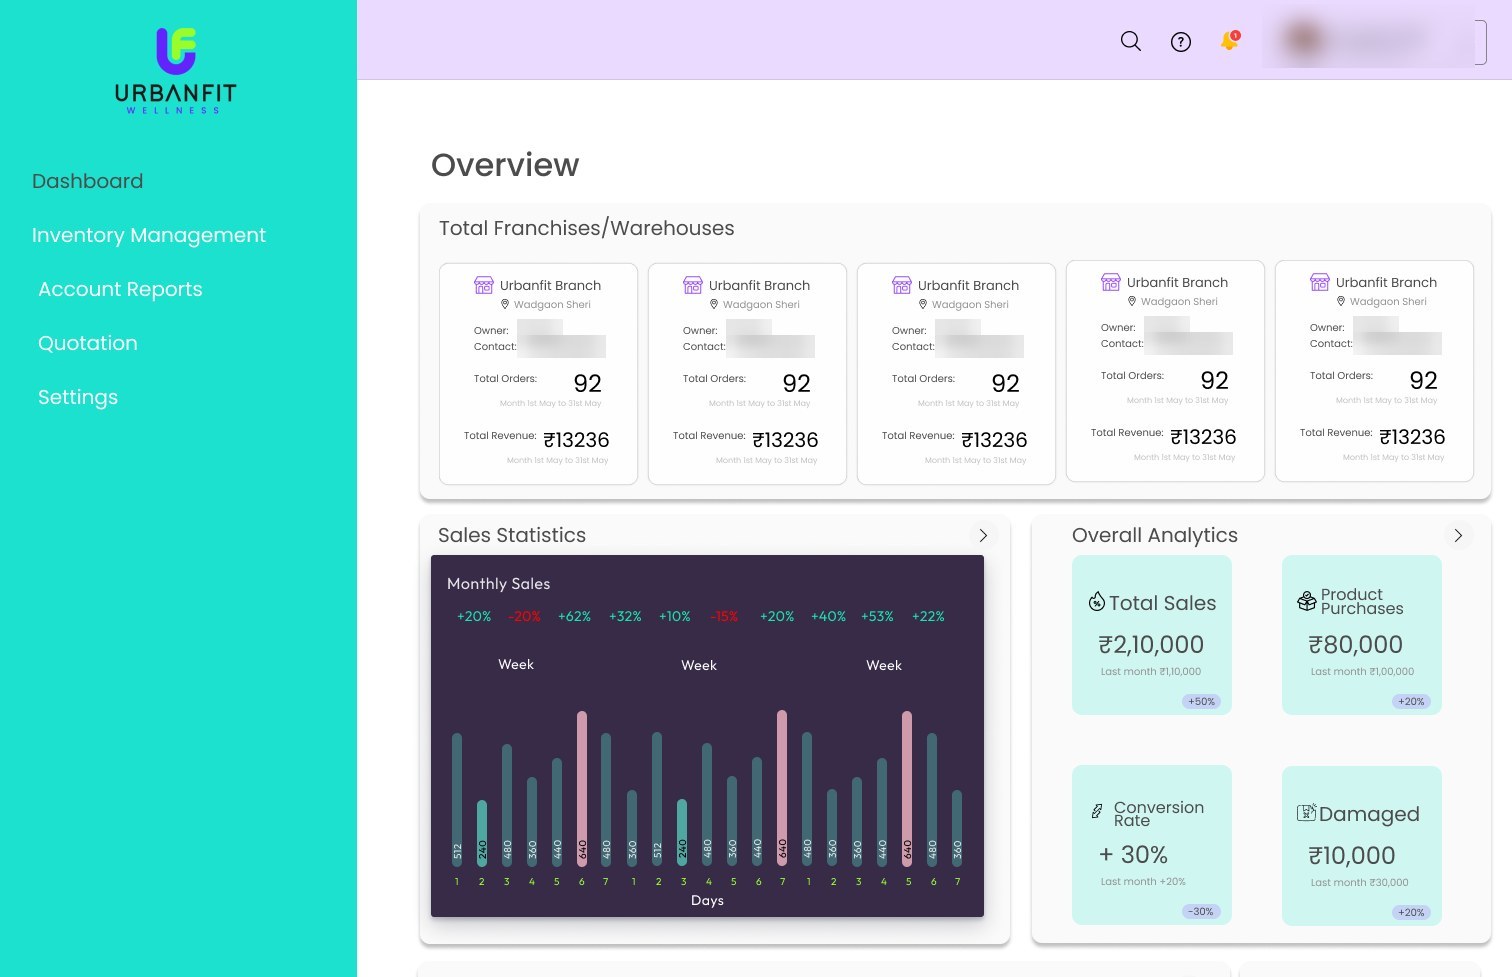
A fixed sidebar holds five sections: Dashboard, Inventory Management, Account Reports, Quotation and Settings. The Figma page groups screens by who sees them: an admin, warehouse or shop dashboard, inventory access and settings access.
- Add stock to warehouse
- Set channel prices
- Distribute to a shop
- Shop sells or quotes
- Sales and ledger reports
- 484Prototype interactions
- 203Navigate between screens
- 246Change a component's state: 167 on click, 79 on hover
- 18Open an overlay: filters and forms
Same layout, different scope
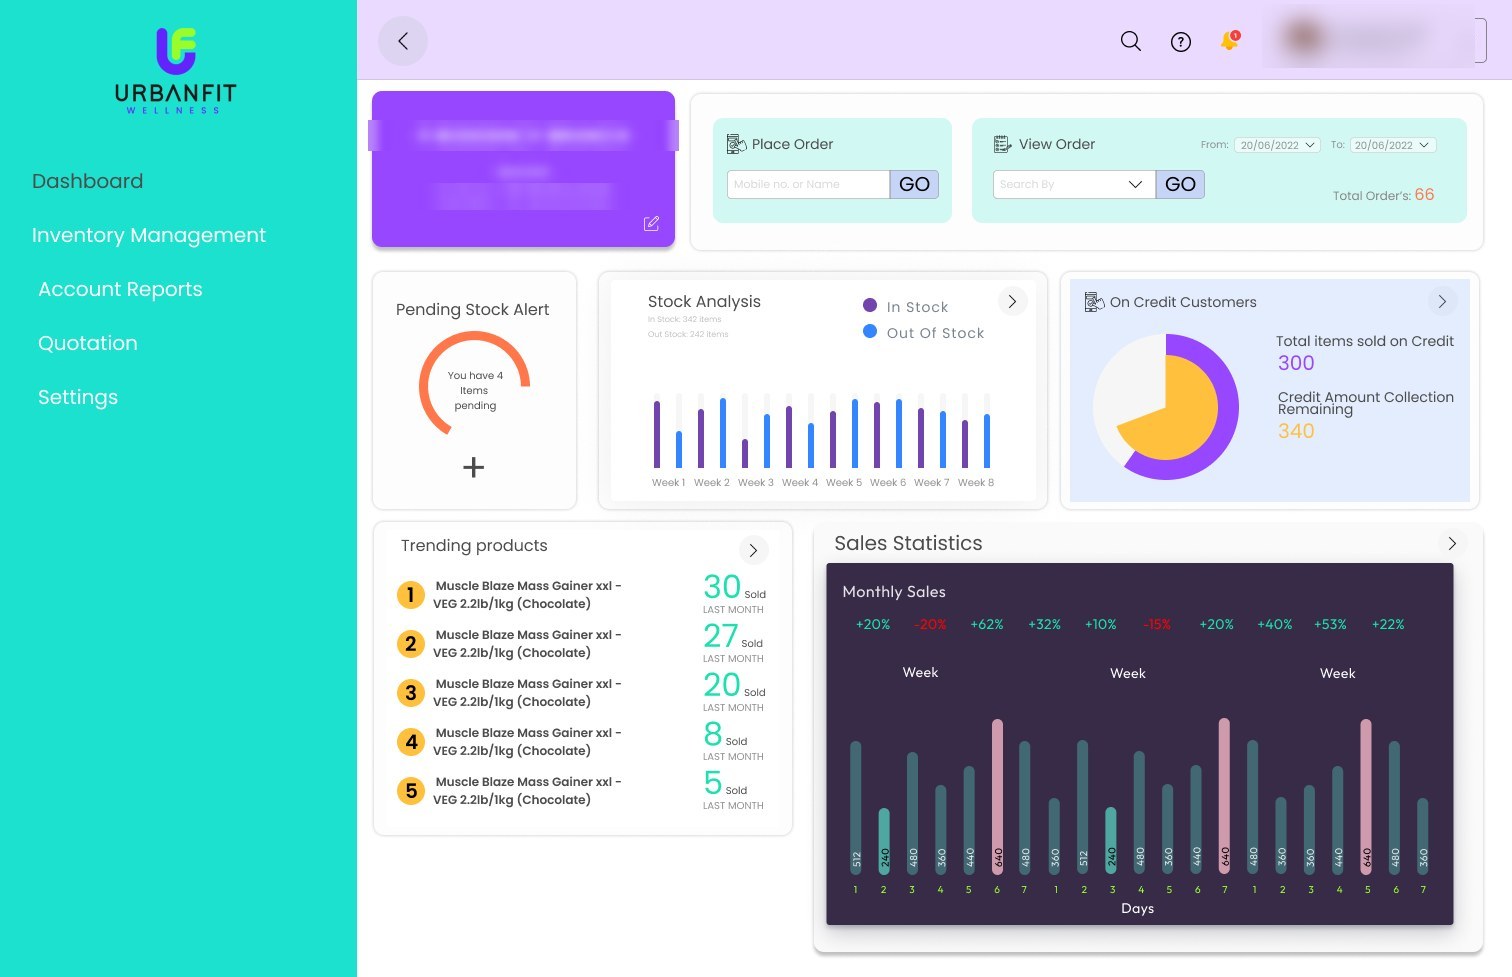
The admin dashboard compares branches. The shop dashboard answers a shop owner's first questions: what to reorder, what's selling, and who owes money.
One purchase price, three selling prices
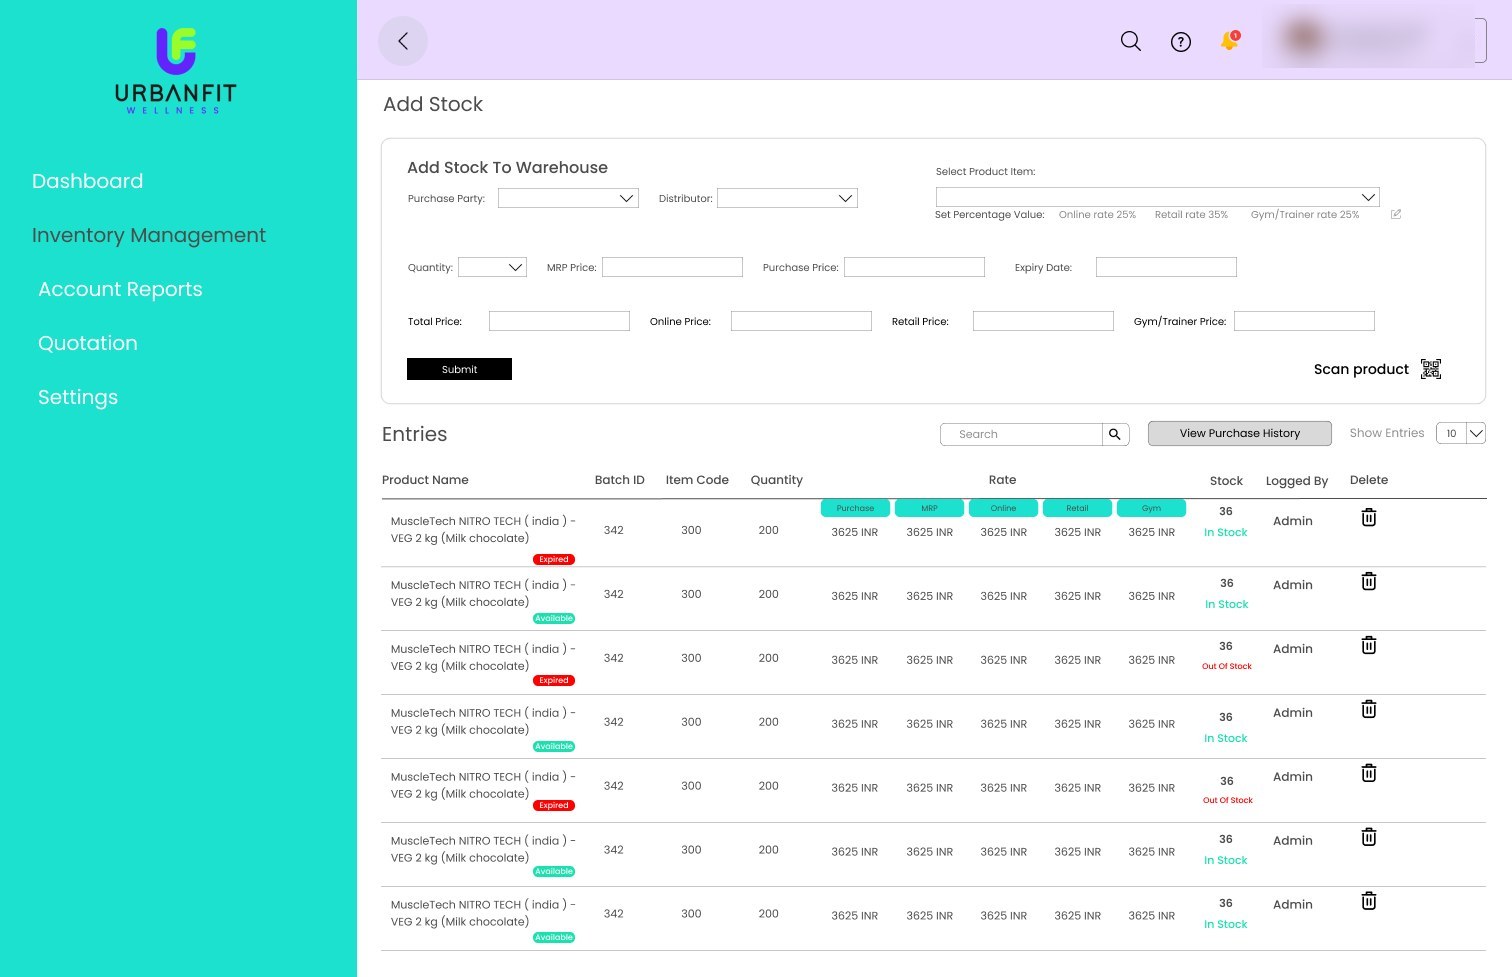
Adding stock and sending it to a shop use the same form. The key interaction is the price calculator: enter the MRP once, set a percentage for each channel, and the online, retail and gym-trainer prices fill in.
Try the calculator
A working recreation of the pattern. It assumes each percentage is taken off the MRP.
In the Figma file, an MRP of 3000 with 25%, 35% and 25% gives 2250, 1950 and 1650. The first two match this rule; 1650 matches 45%, not the 25% shown, so one of the two values in the design needs correcting.
Tables people can act on
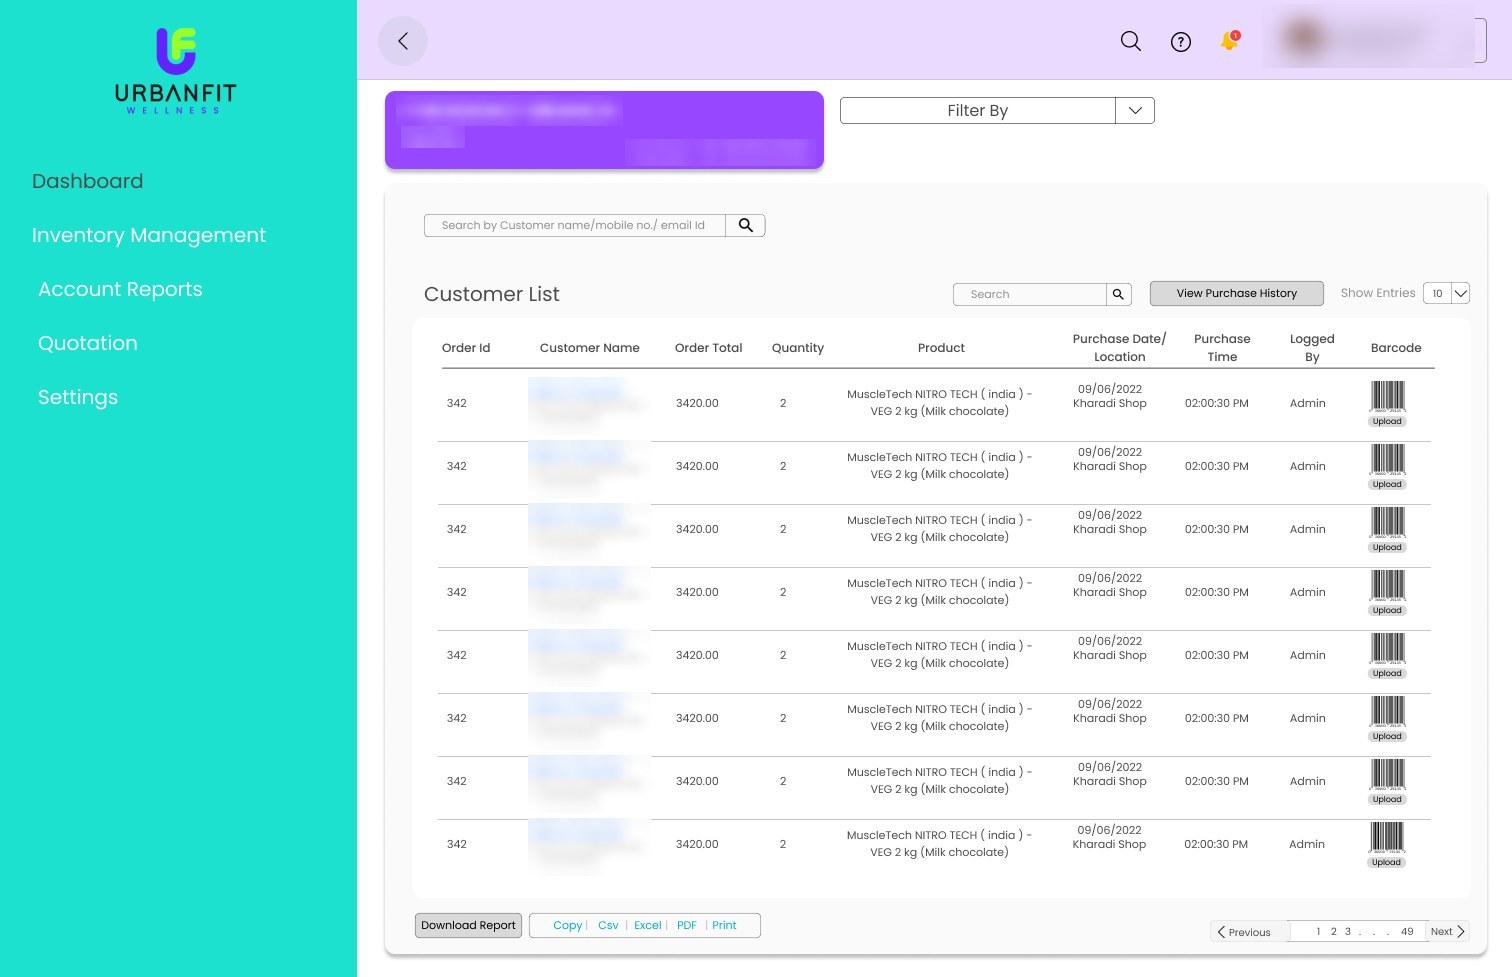
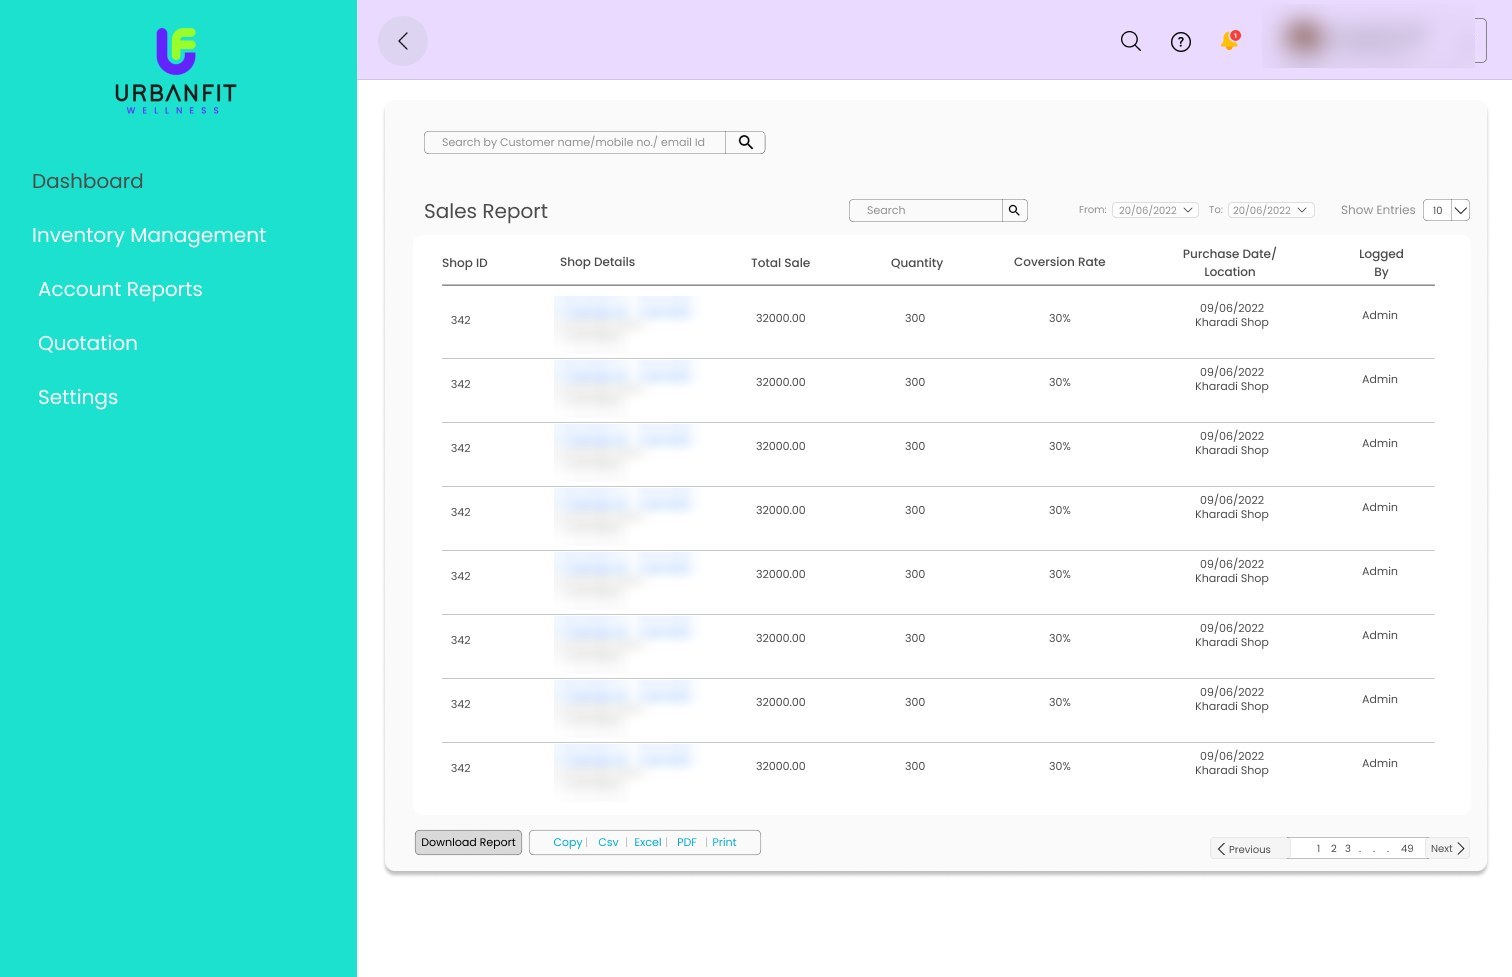
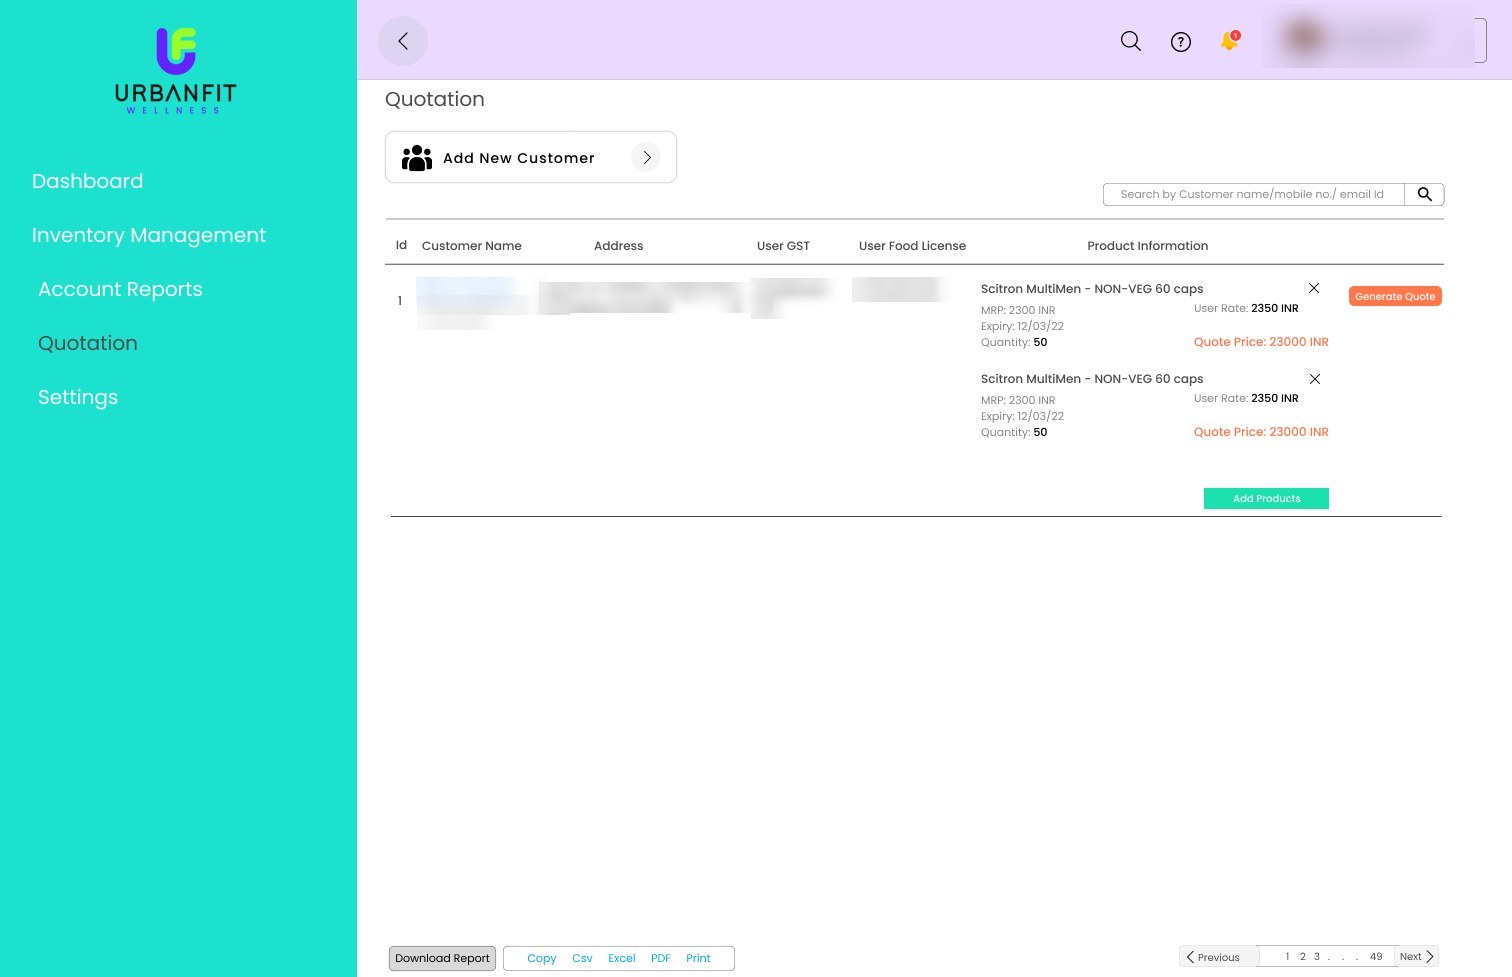
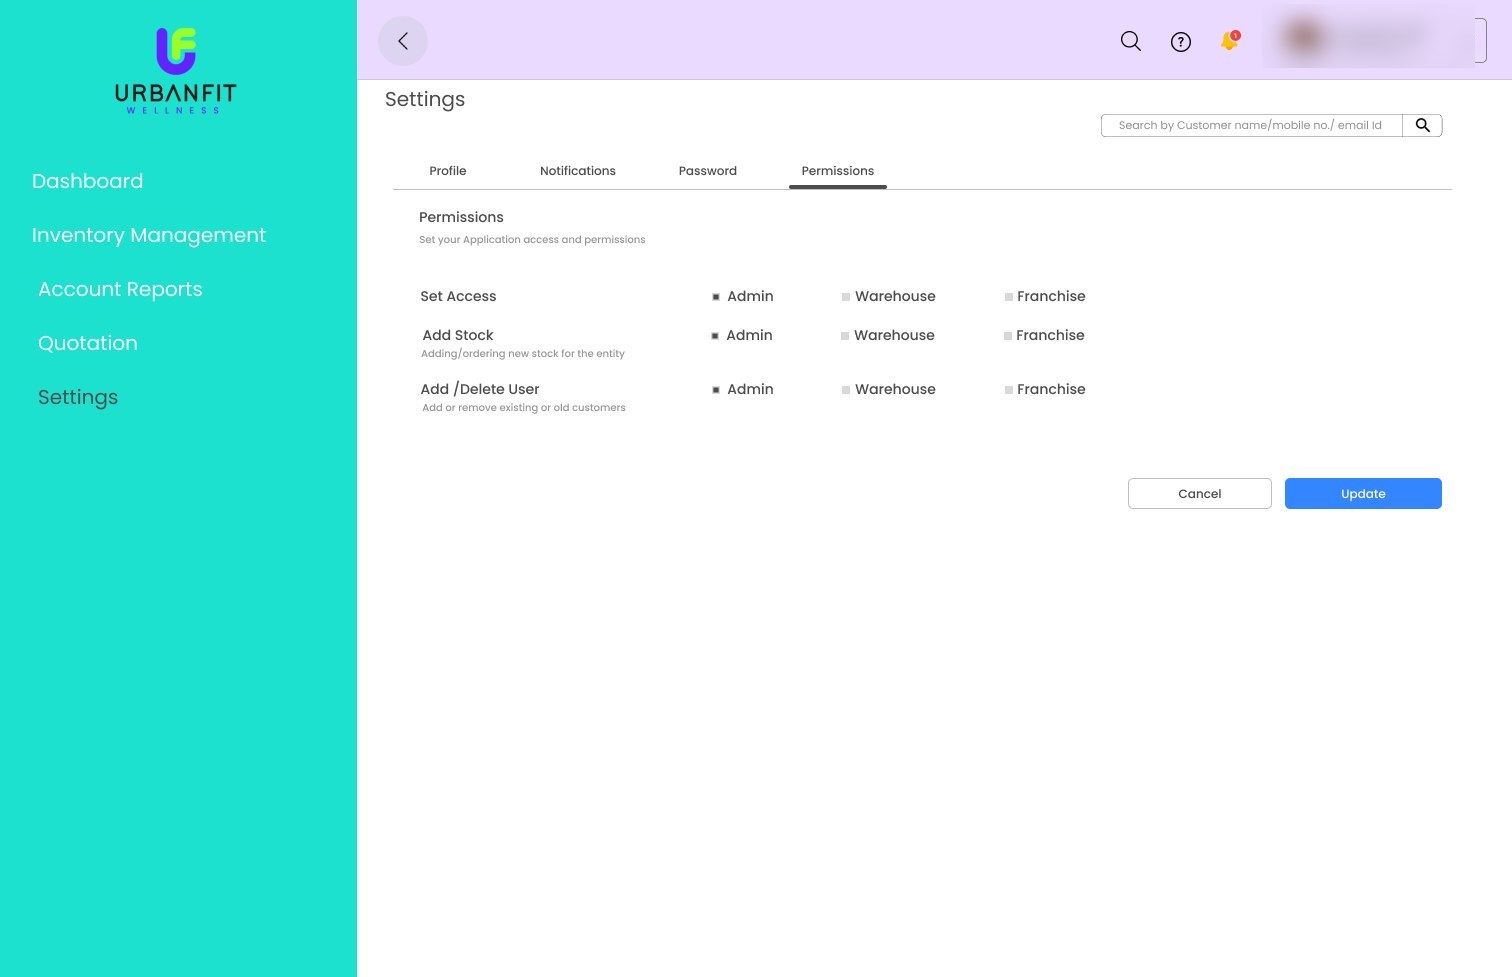
Lists share one table pattern: entries per page, search, export to Copy, CSV, Excel, PDF or Print, and pagination. Quotes and permissions build on the same parts. Permissions are a grid of actions (set access, add stock, add or delete users) against the Admin, Warehouse and Franchise roles.
The parts behind 30 screens
The page has 19 component sets: the user menu (27 uses), status labels (25), category and brand pickers, sort menus and the four settings tabs. Charts use a shared data-visualisation library. No variables are bound. Below are recreated specimens, with fixes where the originals fail contrast.
Stock status
Component 14 · 15 · 25 usesAs designed, the status words are green (#1BE1AF, 1.69:1) and orange (#FF774A, 2.63:1) on white. The fix uses dark text on a tinted chip, plus an icon, so status isn't shown by colour alone.
Sidebar navigation
Fixed left rail · 5 sectionsWhite labels on the teal rail are 1.65:1. Keeping teal for the selected item and darkening the rail fixes every label, to 10.3:1 and up.
Table toolbar
Repeated on every listOne toolbar on every list, so exports always live in the same place. Real buttons with visible outlines (3:1 or more) and a 36px minimum height.
Checked against WCAG 2.2 AA
Data-dense tools are used for hours at a time, so small text and low contrast cost more here than on a marketing page. Counts come from the 2,971 text layers inside the 30 screens.
- 2,047Of 2,971 text layers are smaller than 12px, down to 8px
- 1.65:1White sidebar labels on teal, on every screen
- 79Hover-only state changes that need a keyboard equivalent
| Finding | WCAG 2.2 | Severity | Fix |
|---|---|---|---|
| White sidebar labels on teal | 1.4.3 Contrast | High | 1.65:1. Darken the rail; keep teal for the selected item. |
| Most table text is 8 to 11px | 1.4.4 Resize text · 1.4.10 Reflow | High | 14px table text; tables scroll inside their own box at 200% zoom. |
| Grey text #C0C0C0, #979797, #909090, #858585 | 1.4.3 Contrast | High | 1.82 to 3.69:1. Use #4D4D4D, which passes at 8.45:1 on white. |
| Status in green and orange text only | 1.4.1 Use of colour · 1.4.3 | High | Dark text in a tinted chip, plus an icon. |
| 79 hover states | 2.1.1 Keyboard · 2.4.7 Focus visible · 1.4.13 | Medium | Show the same change on keyboard focus, with a visible focus ring. |
| 18 overlays for filters and forms | 2.4.3 Focus order · 2.4.11 Focus not obscured | Medium | Move focus into the dialog, trap it there, return it on close; Escape closes. |
| Blue Update button, white label | 1.4.3 Contrast | Medium | 3.5:1. Use a darker blue such as #0A6FE0 (4.81:1). |
| Data tables | 1.3.1 Info and relationships | Medium | Build as real tables with header cells and a caption, so screen readers read column names. |
| Spelling in labels: "Coversion Rate", "Paid Amuont", "Reciepts", "Itenary" | Content quality, not WCAG | Low | Fix before build; screen readers read them as written. |
What I'd do next
Roles shape the screen
Admin, warehouse and shop views share one layout, so training is shared too, while each role sees only its own scope.
Pricing as a pattern
One purchase price feeding three channel prices removes manual sums, the most error-prone step in a franchise business.
Built for reading all day
Raise text sizes, fix contrast and bind colours to tokens. People live in this tool, so small type is a daily cost.
To validate next
- Task-test "send 20 units to a shop" and "find who owes money" with 3 to 5 people per role. Report counts, not percentages.
- Measure transfer errors: transfers corrected afterwards, out of all transfers, before and after launch.
- Check every screen at 200% zoom and with keyboard only.
Screens are exported from the Urbanfit Control Panel Figma file. People's names, contact details, addresses and profile photos are blurred. The calculator, permissions table and component specimens are recreations. No research findings or outcome numbers for this tool are included, because none were in the file.